Note: This article was originally published on the Memgraph blog.
Just as the labyrinth of train tracks intricately connects the bustling stations across geographic areas, relationships in graph databases serve to connect nodes in a complex yet orderly web of data. The Berlin subway system, with its complexity and efficiency, serves as a captivating analogy and an ideal introduction to the world of graphs.
Getting the Data on the Berlin Subway
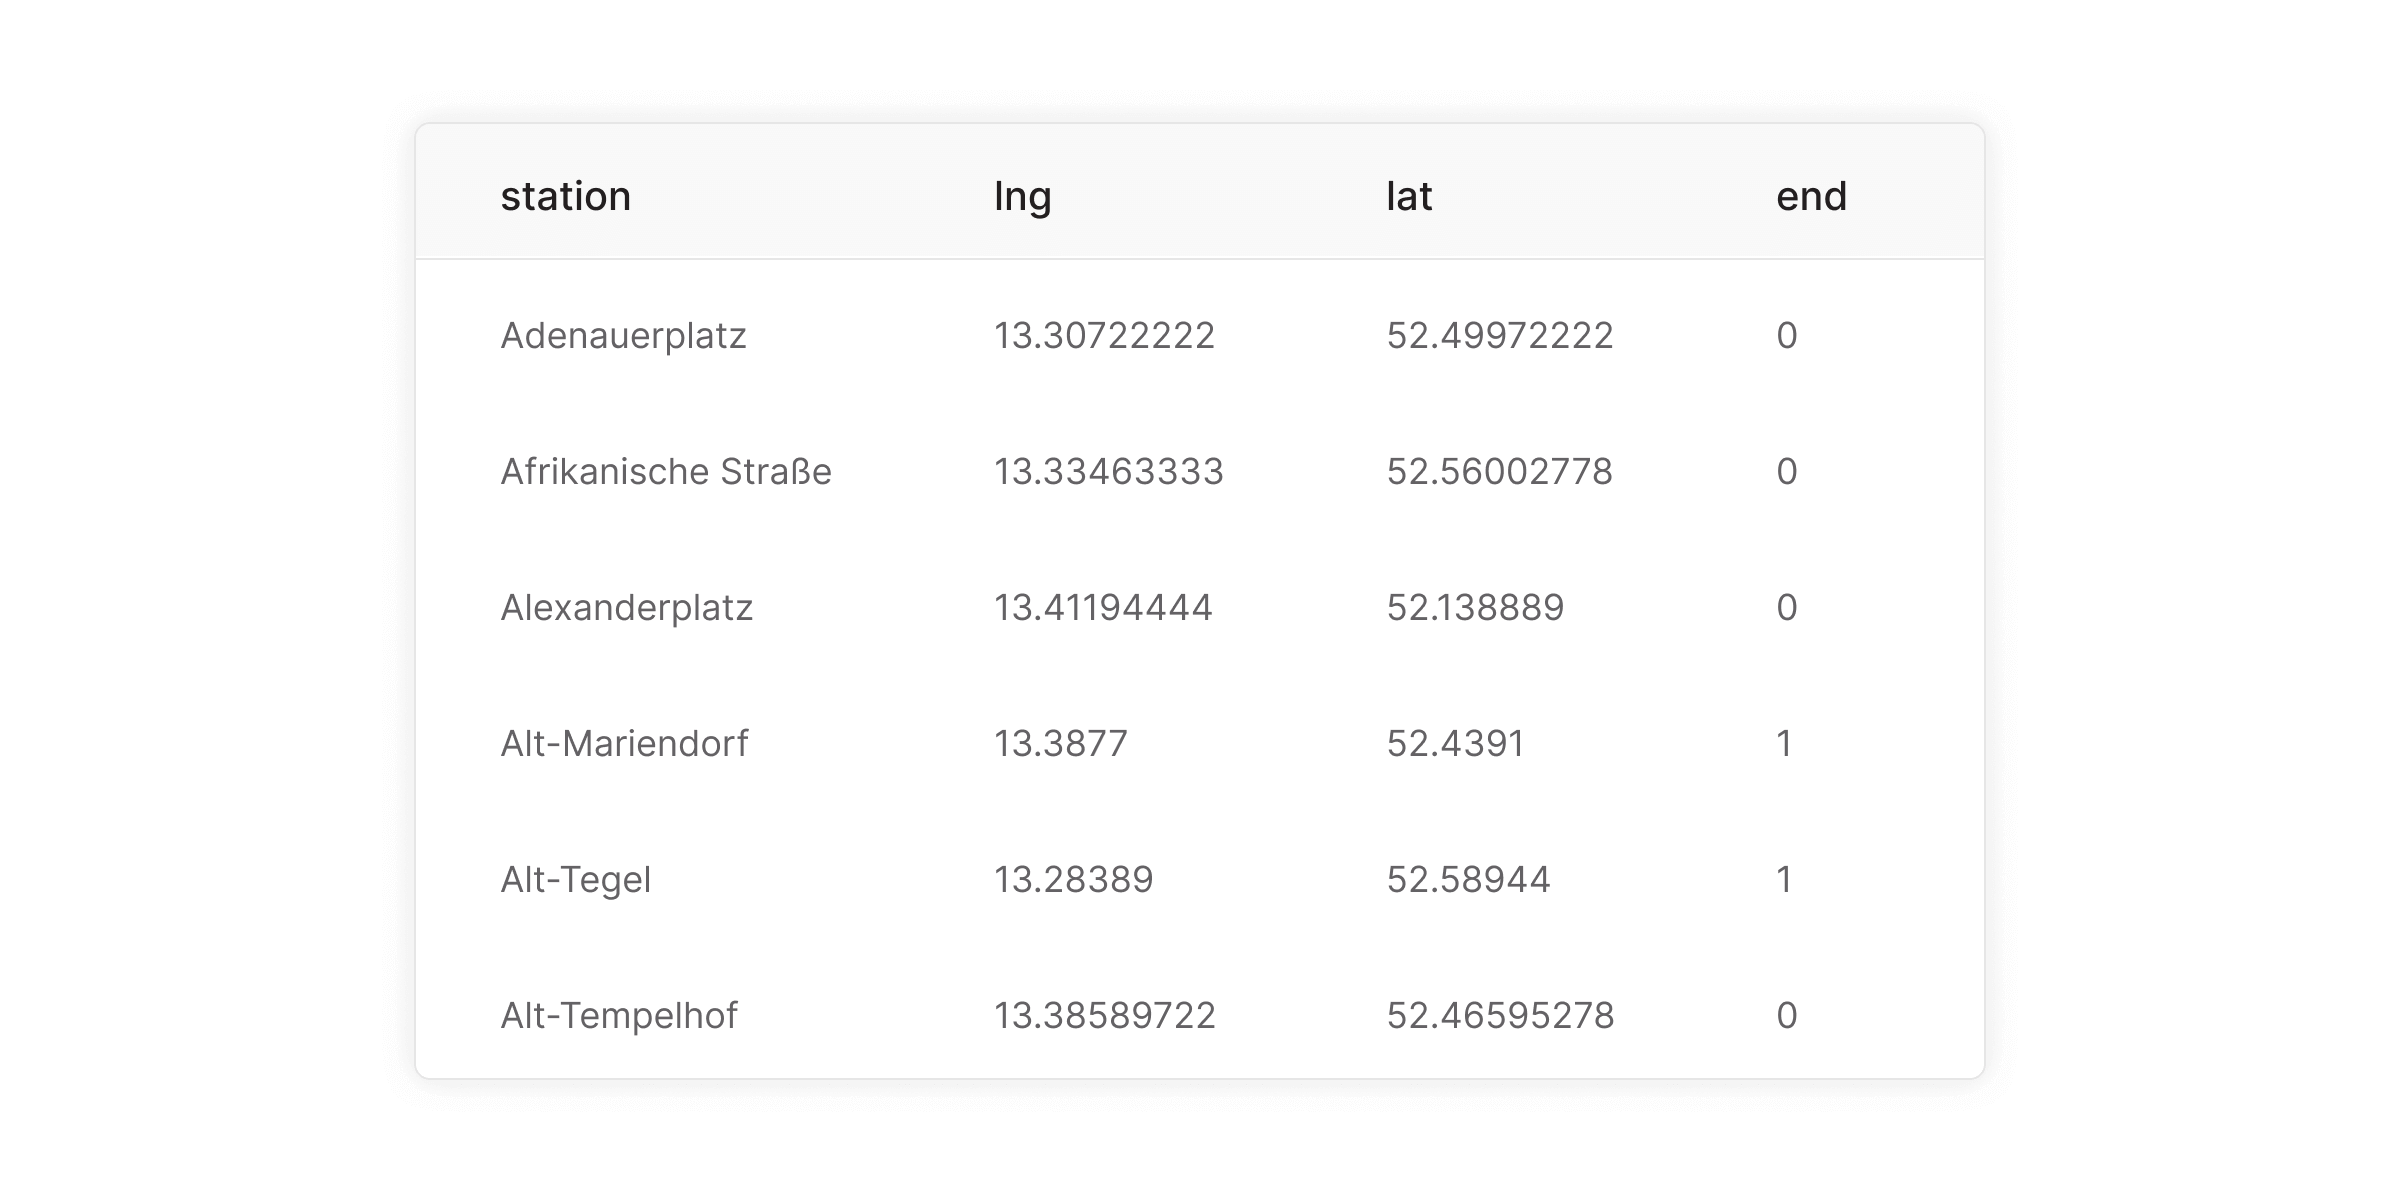
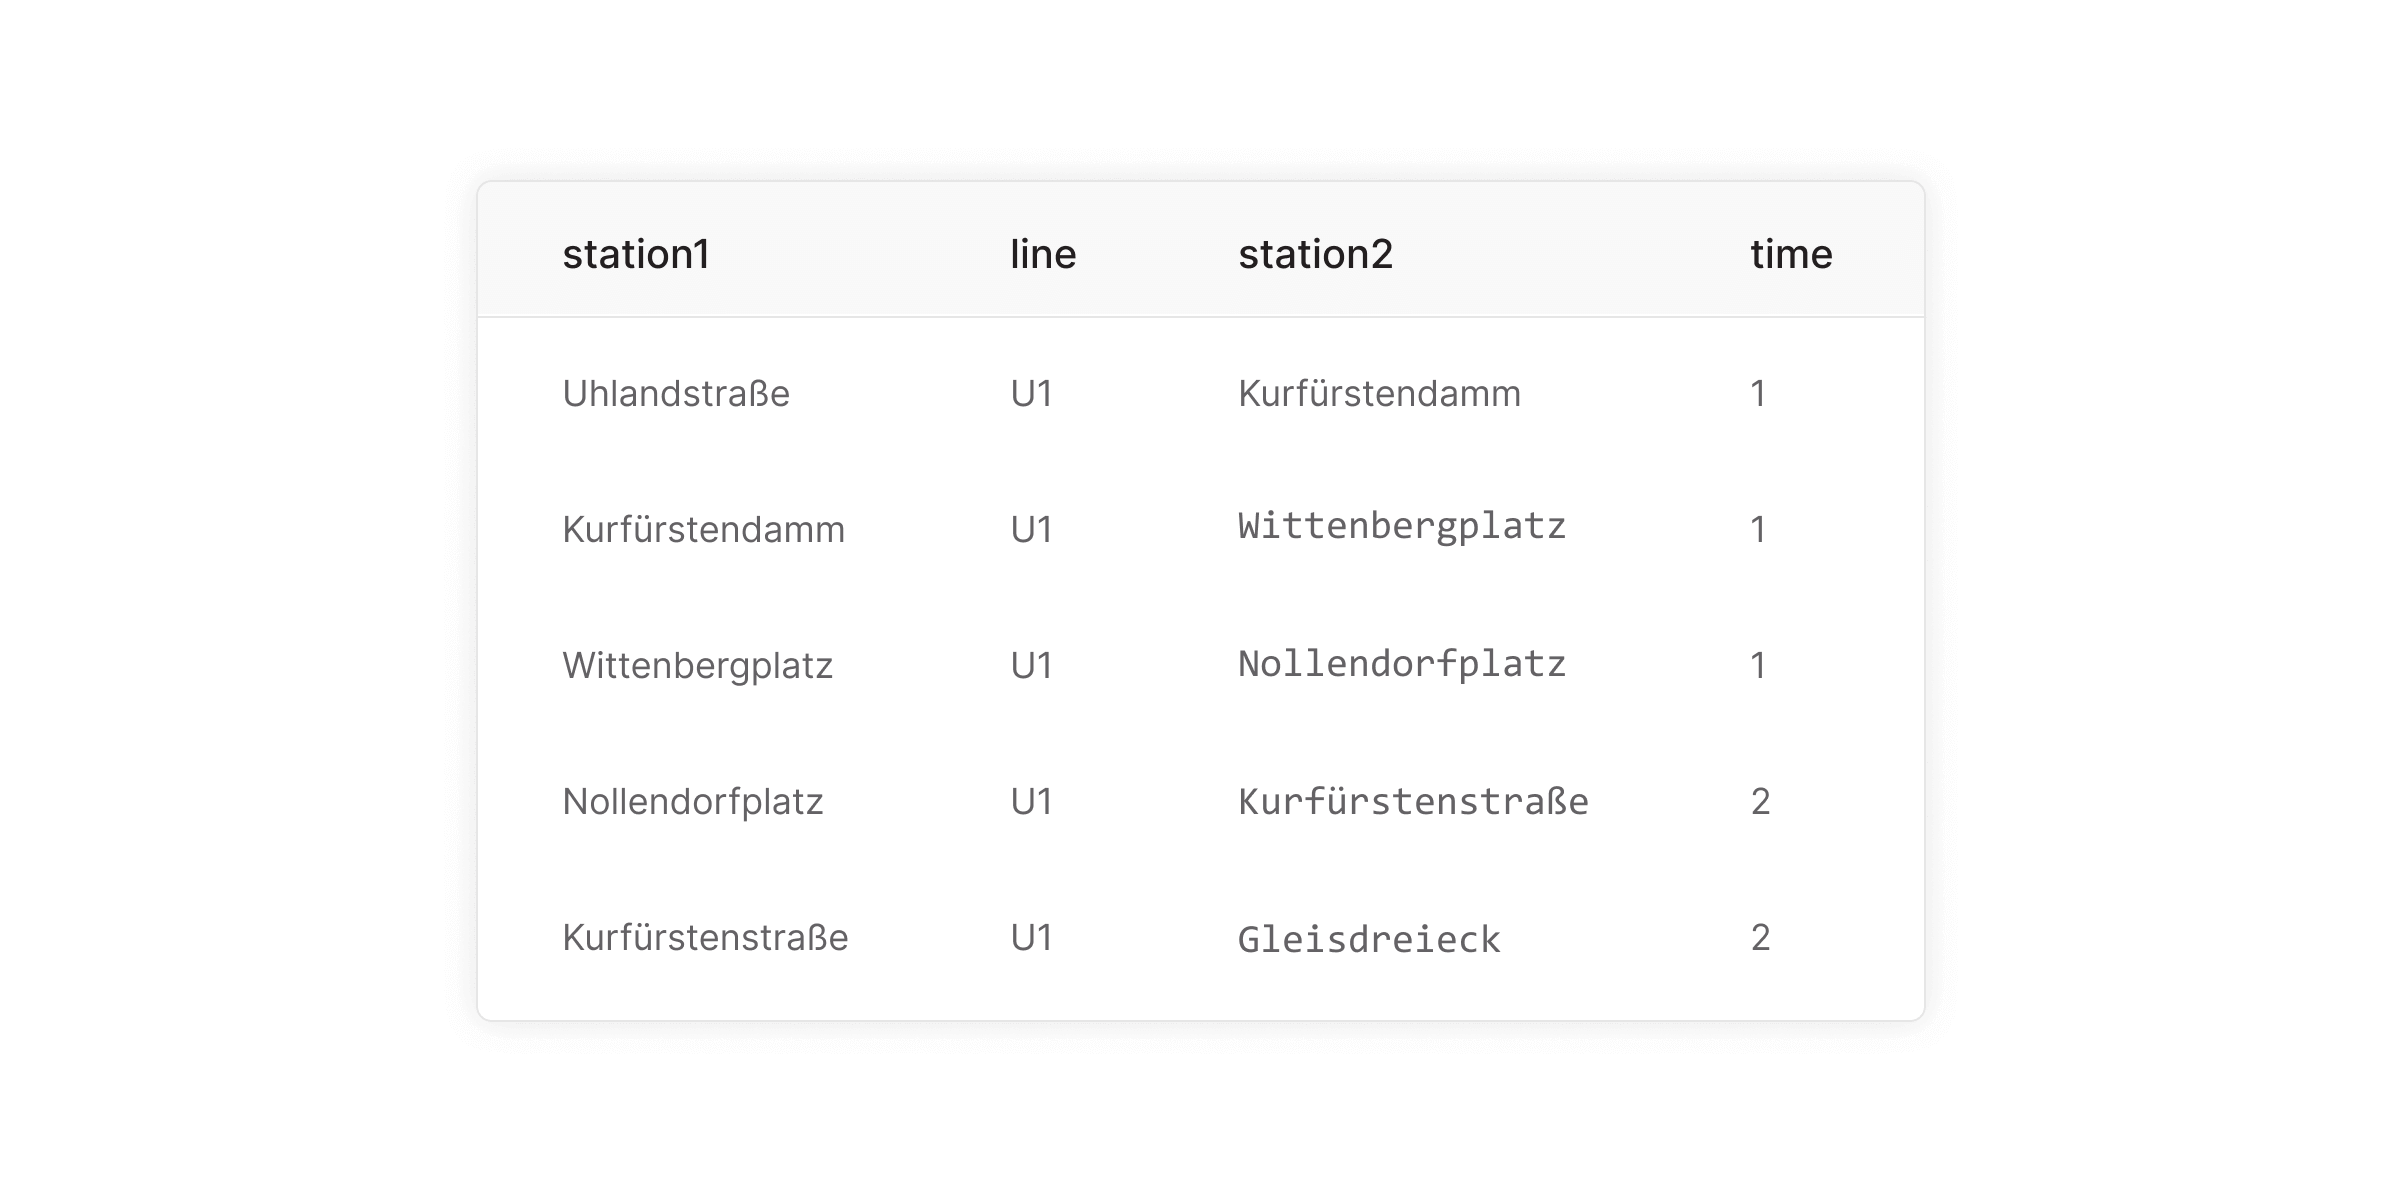
I gathered data on subway stations and lines in CSV files. The berlin-stations.csv file contains information about each subway station, including its name, latitude, longitude, and a flag indicating if it’s an end station. The berlin-lines.csv file describes the connections between stations, the subway line they belong to, and the travel time.
The CSV files are available here:
Setting Up Memgraph
Pull the latest version of Memgraph Platform:
docker run -ti -p 3000:3000 -p 7687:7687 -p 7444:7444 --name berlin-subway memgraph/memgraph-platform:latestImporting the Data
To load the data directly from Memgraph’s website:
LOAD CSV FROM "https://public-assets.memgraph.com/berlin-subway/berlin-stations.csv" WITH HEADER AS row
CREATE (n:Station {name: row.station, lat: toFloat(row.lat), lng: toFloat(row.lng), end: toInteger(row.end)});

LOAD CSV FROM "https://public-assets.memgraph.com/berlin-subway/berlin-lines.csv" WITH HEADER AS row
MATCH (s1:Station {name: row.station1}), (s2:Station {name: row.station2})
CREATE (s1)-[:CONNECTED_VIA {line: row.line, time: ToInteger(row.time)}]->(s2);
If you downloaded the files locally, copy them to your Docker container first:
docker cp berlin-stations.csv berlin-subway:/usr/lib/memgraph/berlin-stations.csv
docker cp berlin-lines.csv berlin-subway:/usr/lib/memgraph/berlin-lines.csv
Then load them from the local path:
LOAD CSV FROM "/usr/lib/memgraph/berlin-stations.csv" WITH HEADER AS row
CREATE (n:Station {name: row.station, lat: toFloat(row.lat), lng: toFloat(row.lng), end: toInteger(row.end)});

LOAD CSV FROM "/usr/lib/memgraph/berlin-lines.csv" WITH HEADER AS row
MATCH (s1:Station {name: row.station1}), (s2:Station {name: row.station2})
CREATE (s1)-[:CONNECTED_VIA {line: row.line, time: ToInteger(row.time)}]->(s2);
Visualize Data in Memgraph Lab
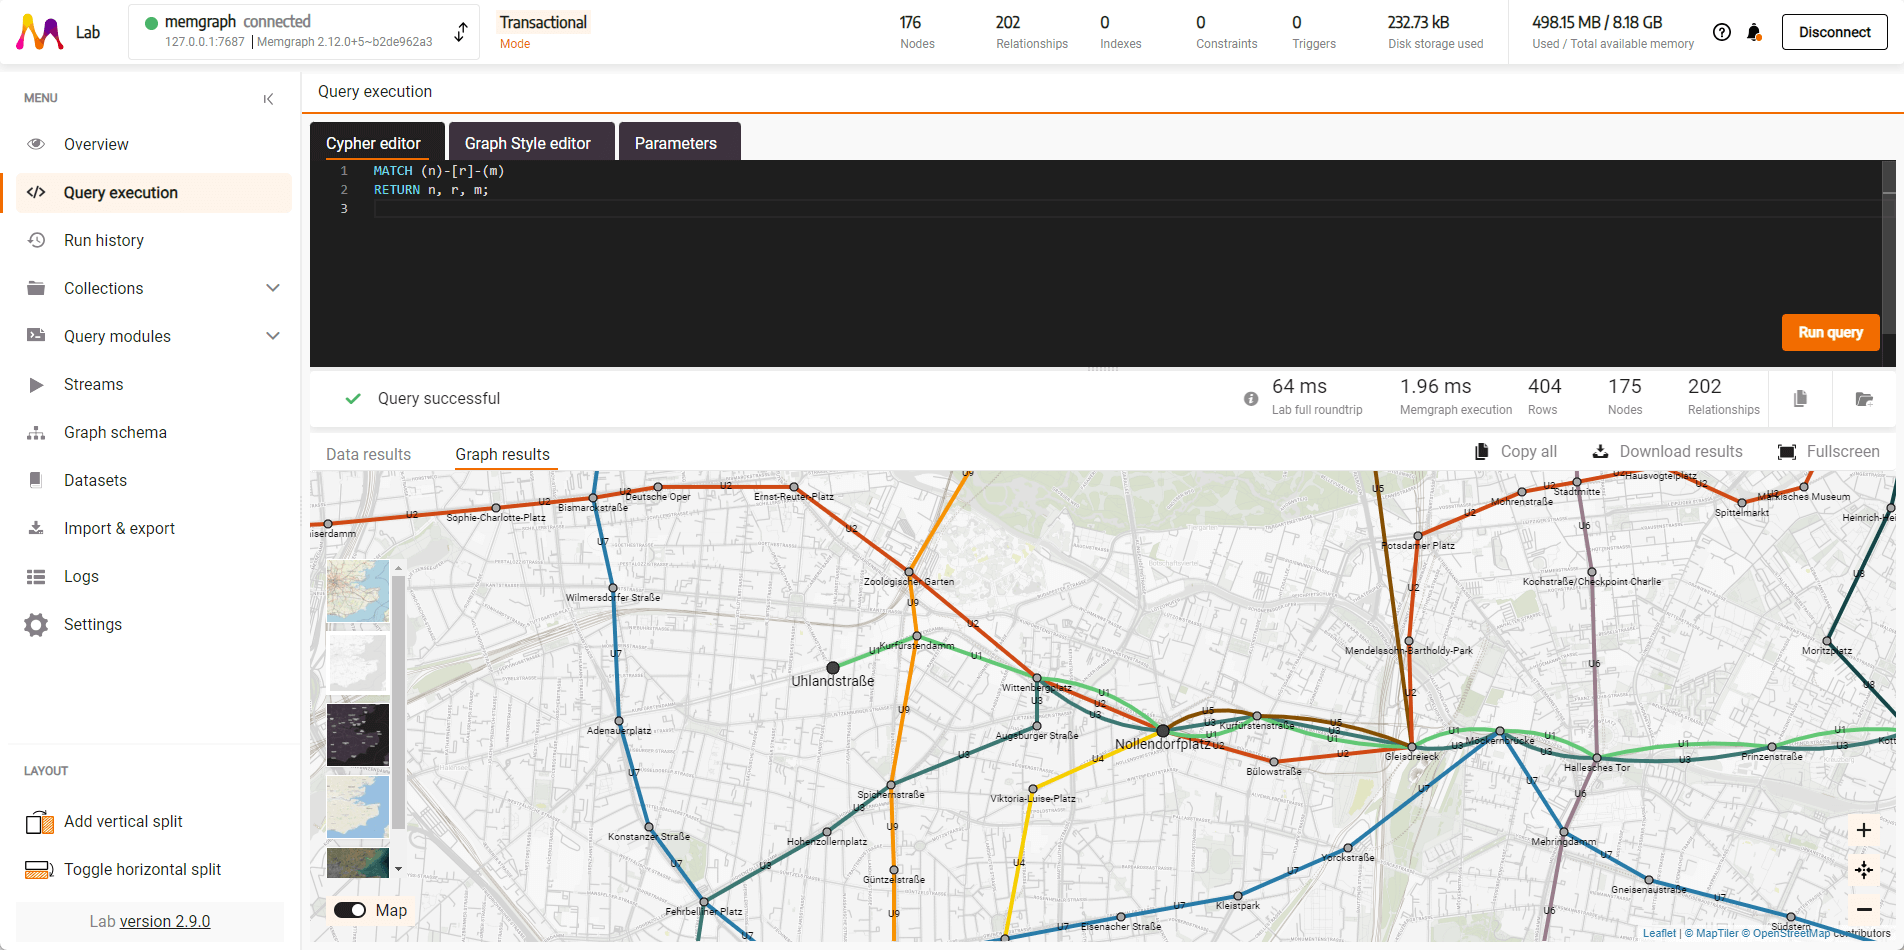
To see all stations and lines:
MATCH (n)-[r]-(m)
RETURN n, r, m;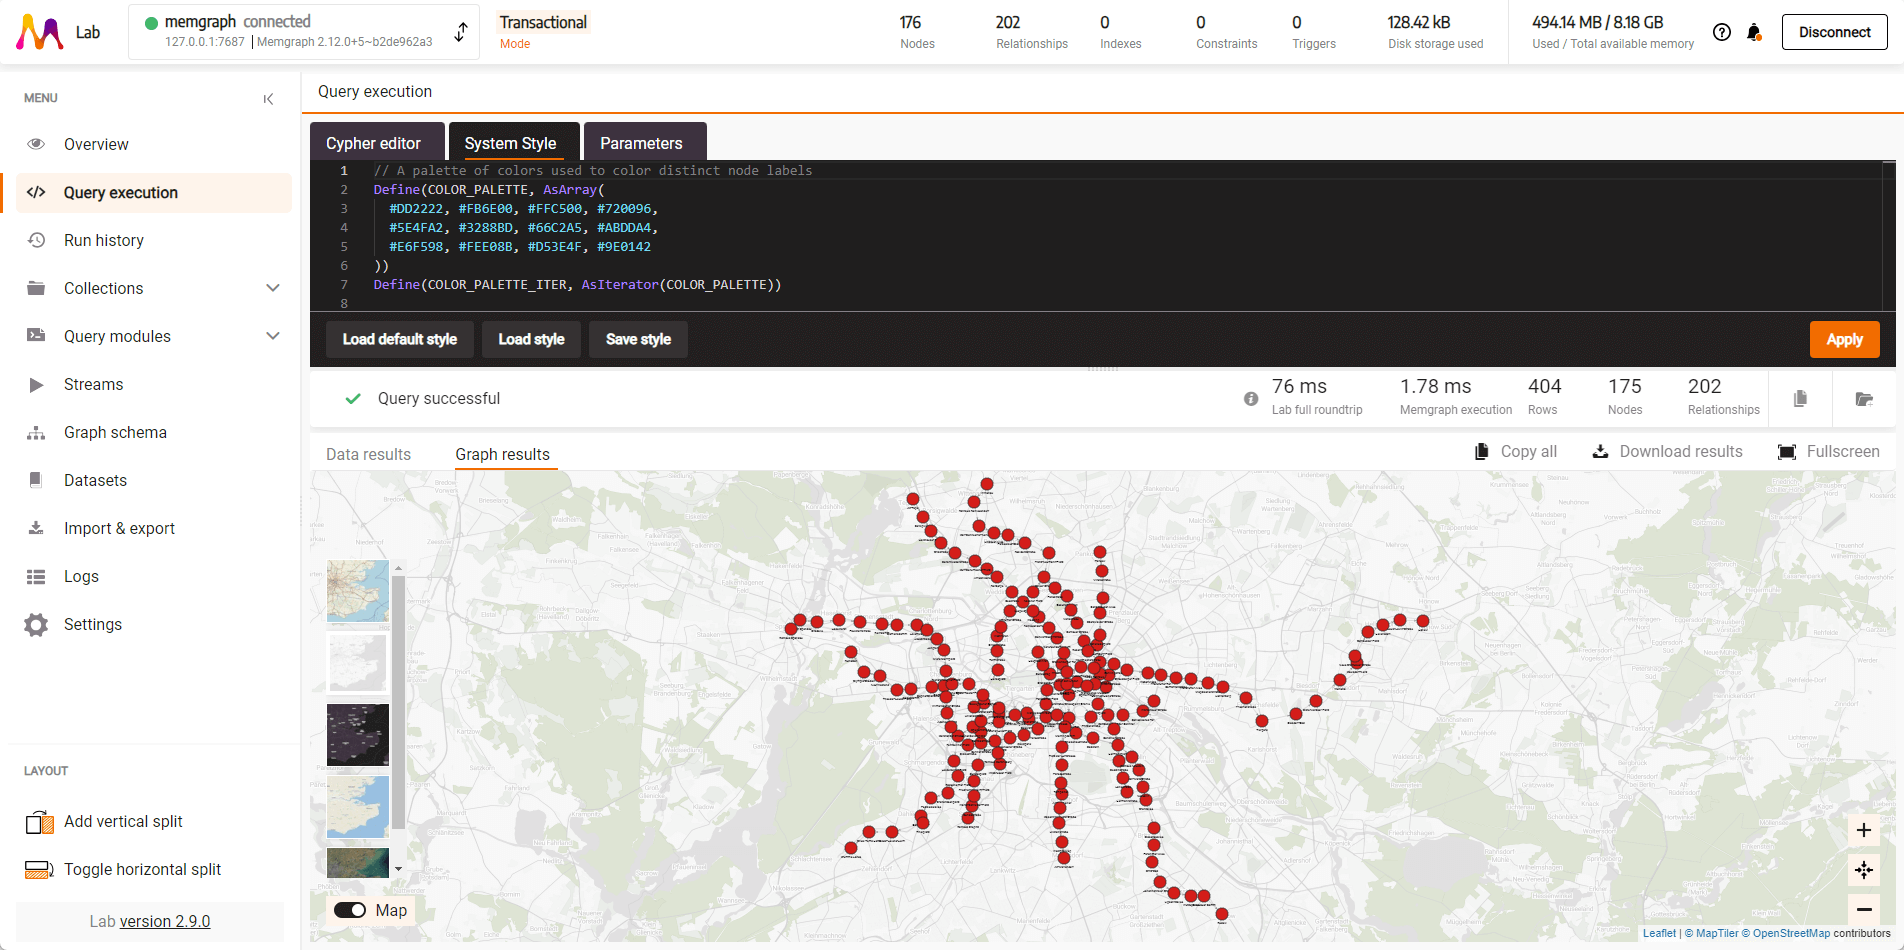
To see only one subway line, for example U1:
MATCH path = (s1:Station)-[r:CONNECTED_VIA {line: 'U1'}]->(s2:Station) RETURN path;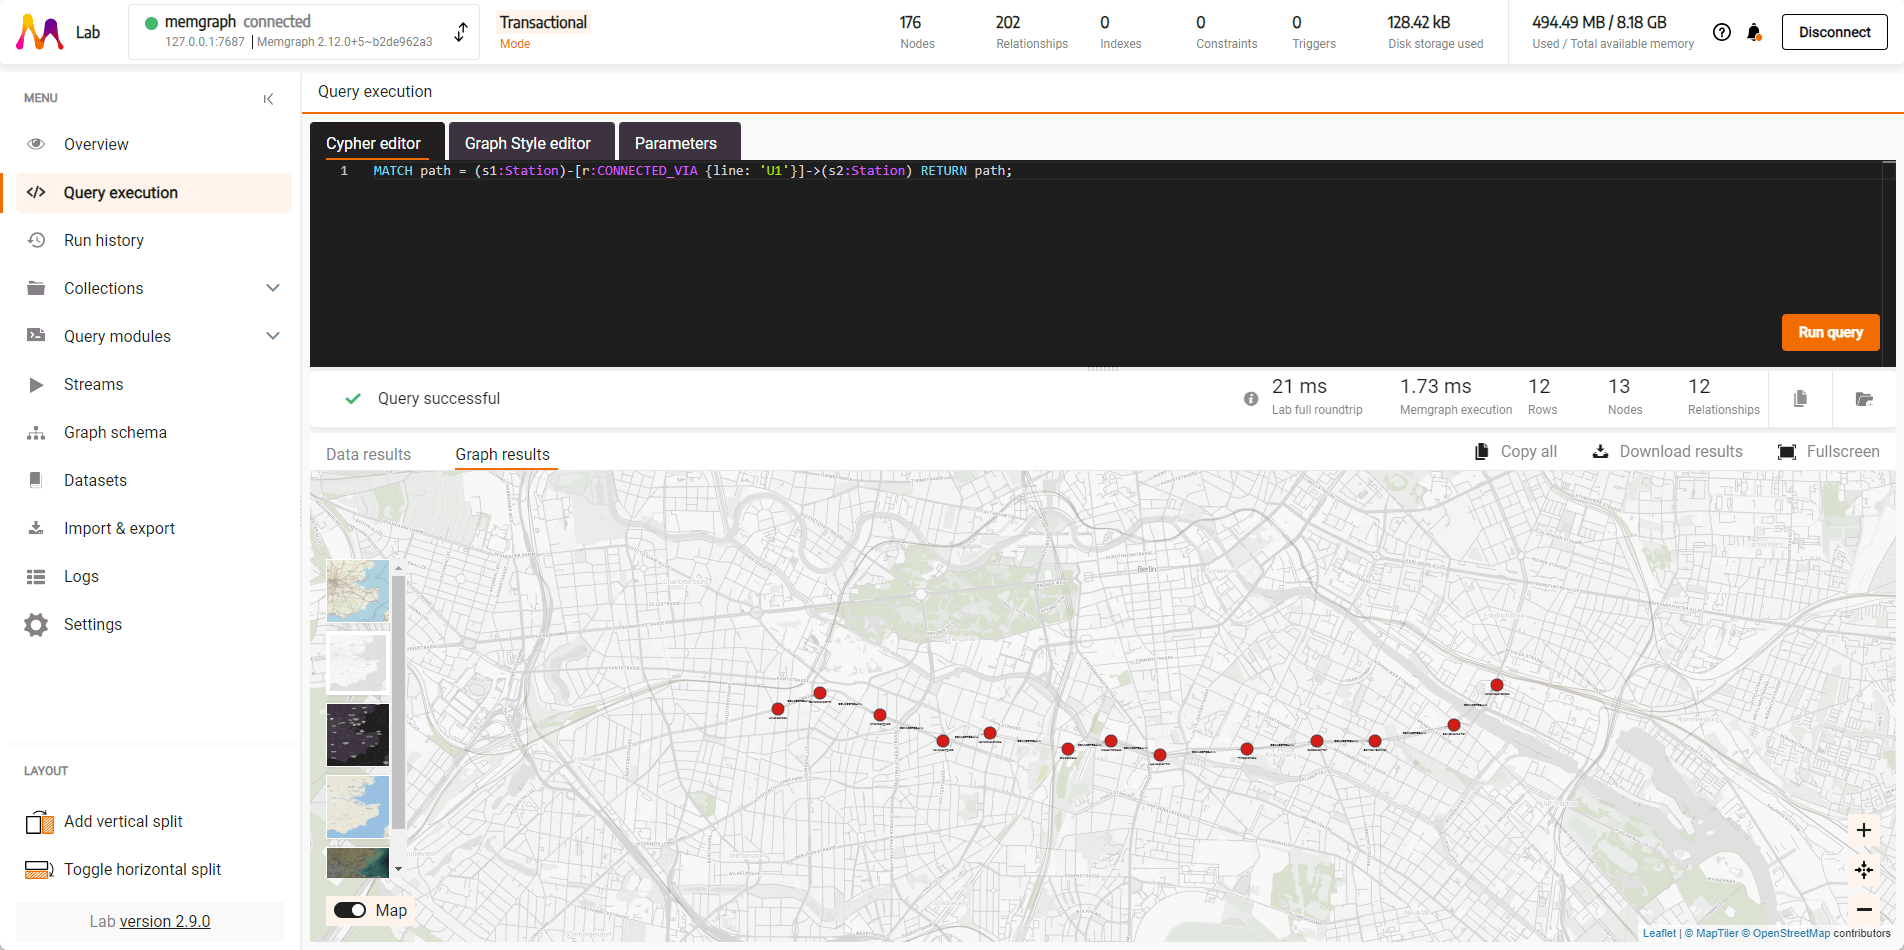
To see two lines (U1 and U6) at the same time:
MATCH path = (s1:Station)-[r1:CONNECTED_VIA {line: 'U1'}]->(s2:Station)
RETURN path
UNION
MATCH path = (s3:Station)-[r2:CONNECTED_VIA {line: 'U6'}]->(s4:Station)
RETURN path;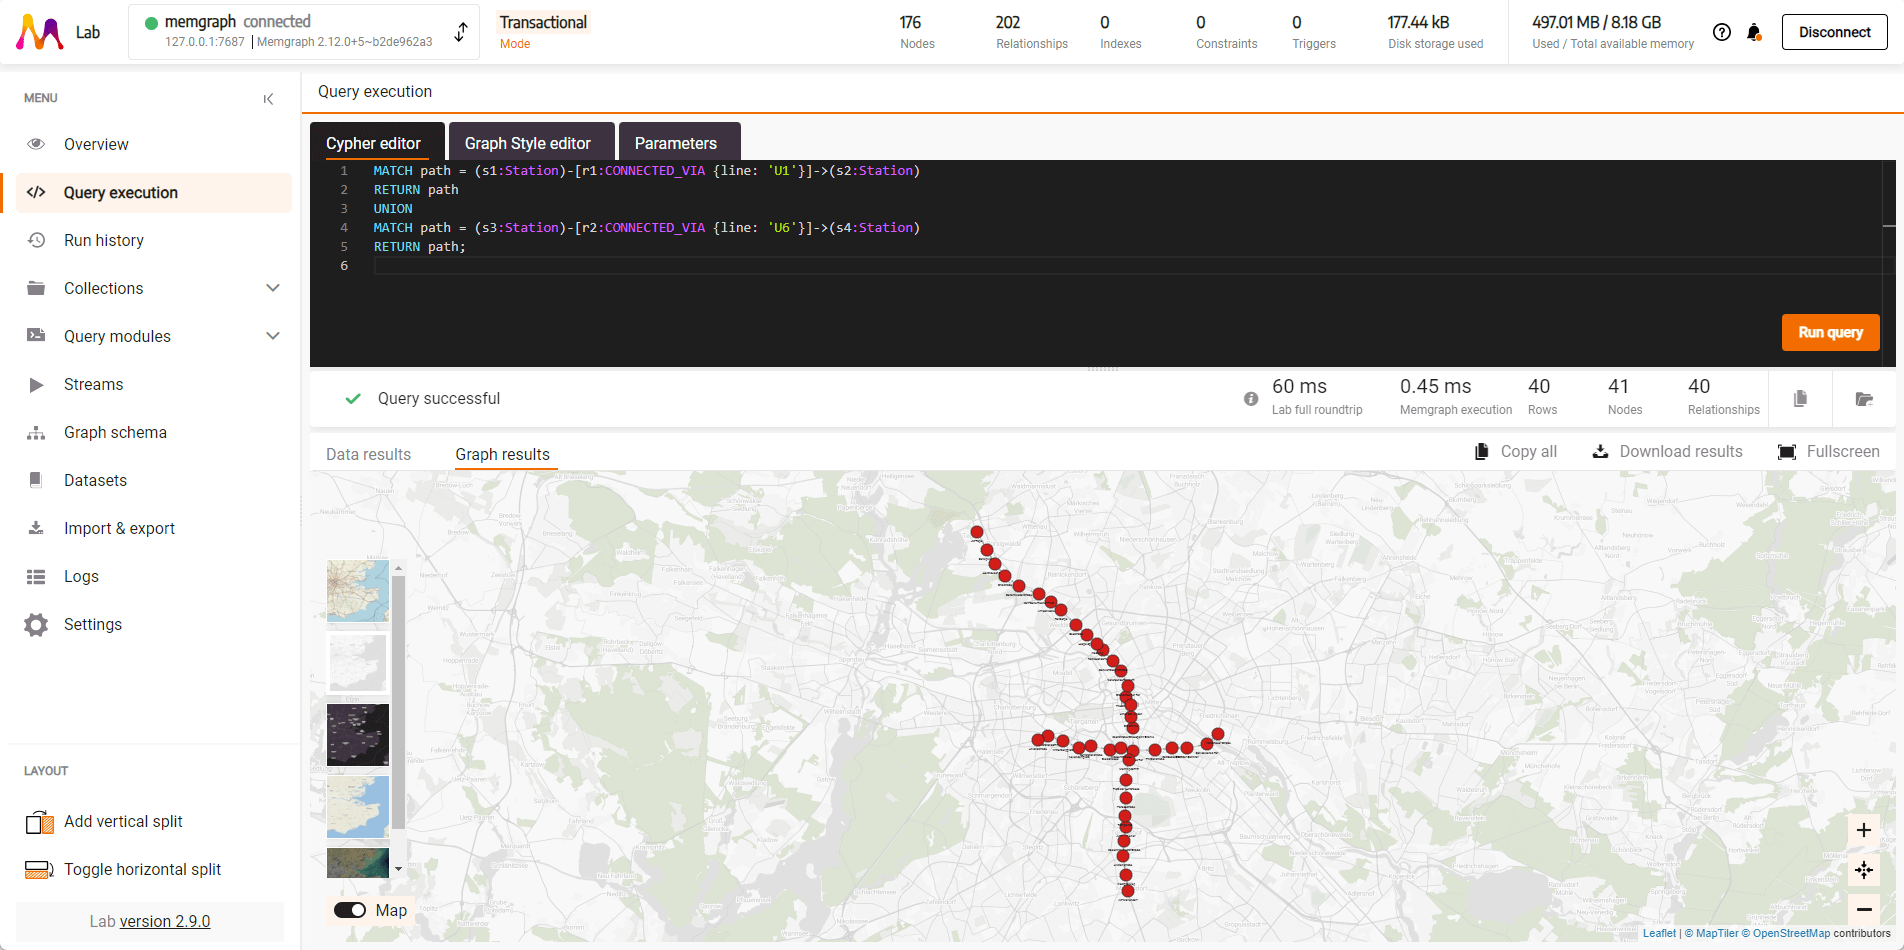
To find the shortest path between two stations using the Weighted Shortest Path algorithm:
MATCH path=(s1:Station {name: "Uhlandstraße"})-[:CONNECTED_VIA *WSHORTEST (r, n | r.time)]-(s2:Station {name: "Spittelmarkt"}) RETURN path;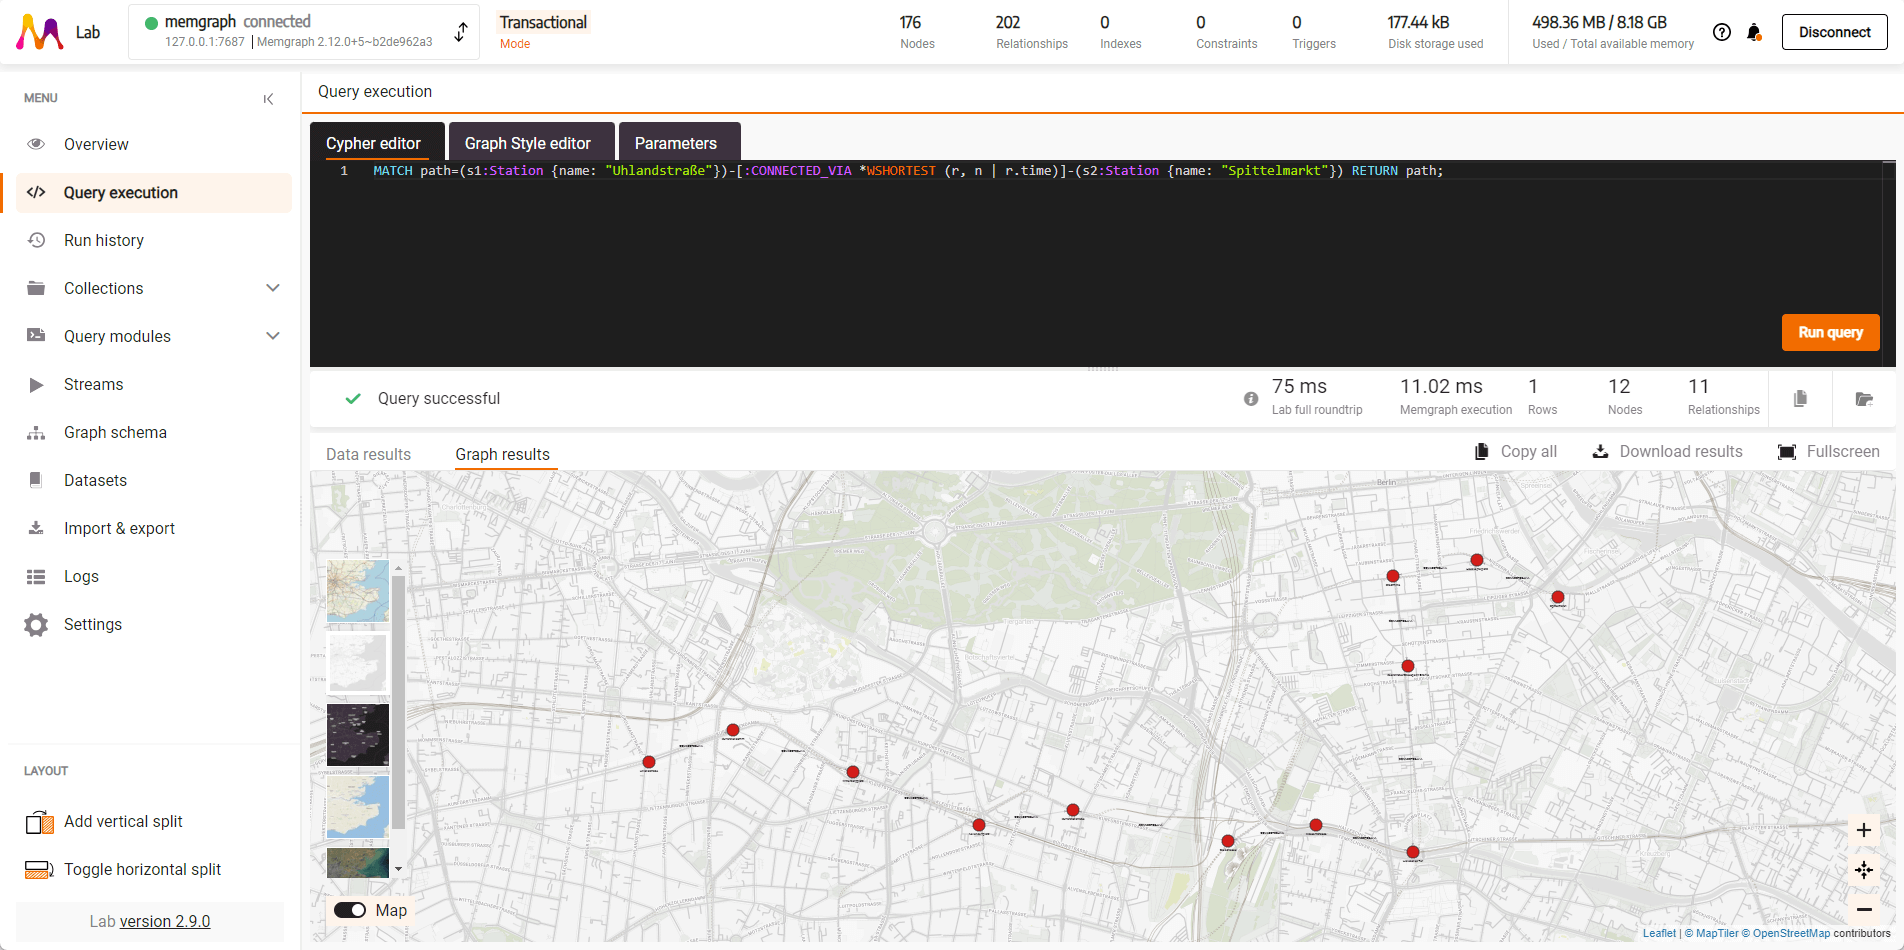
To see what stations are up to two hops away from Stadtmitte:
MATCH (stadtmitte {name: 'Stadtmitte'}), path=(stadtmitte)-[:CONNECTED_VIA*1..2]-(n:Station)
RETURN stadtmitte, n;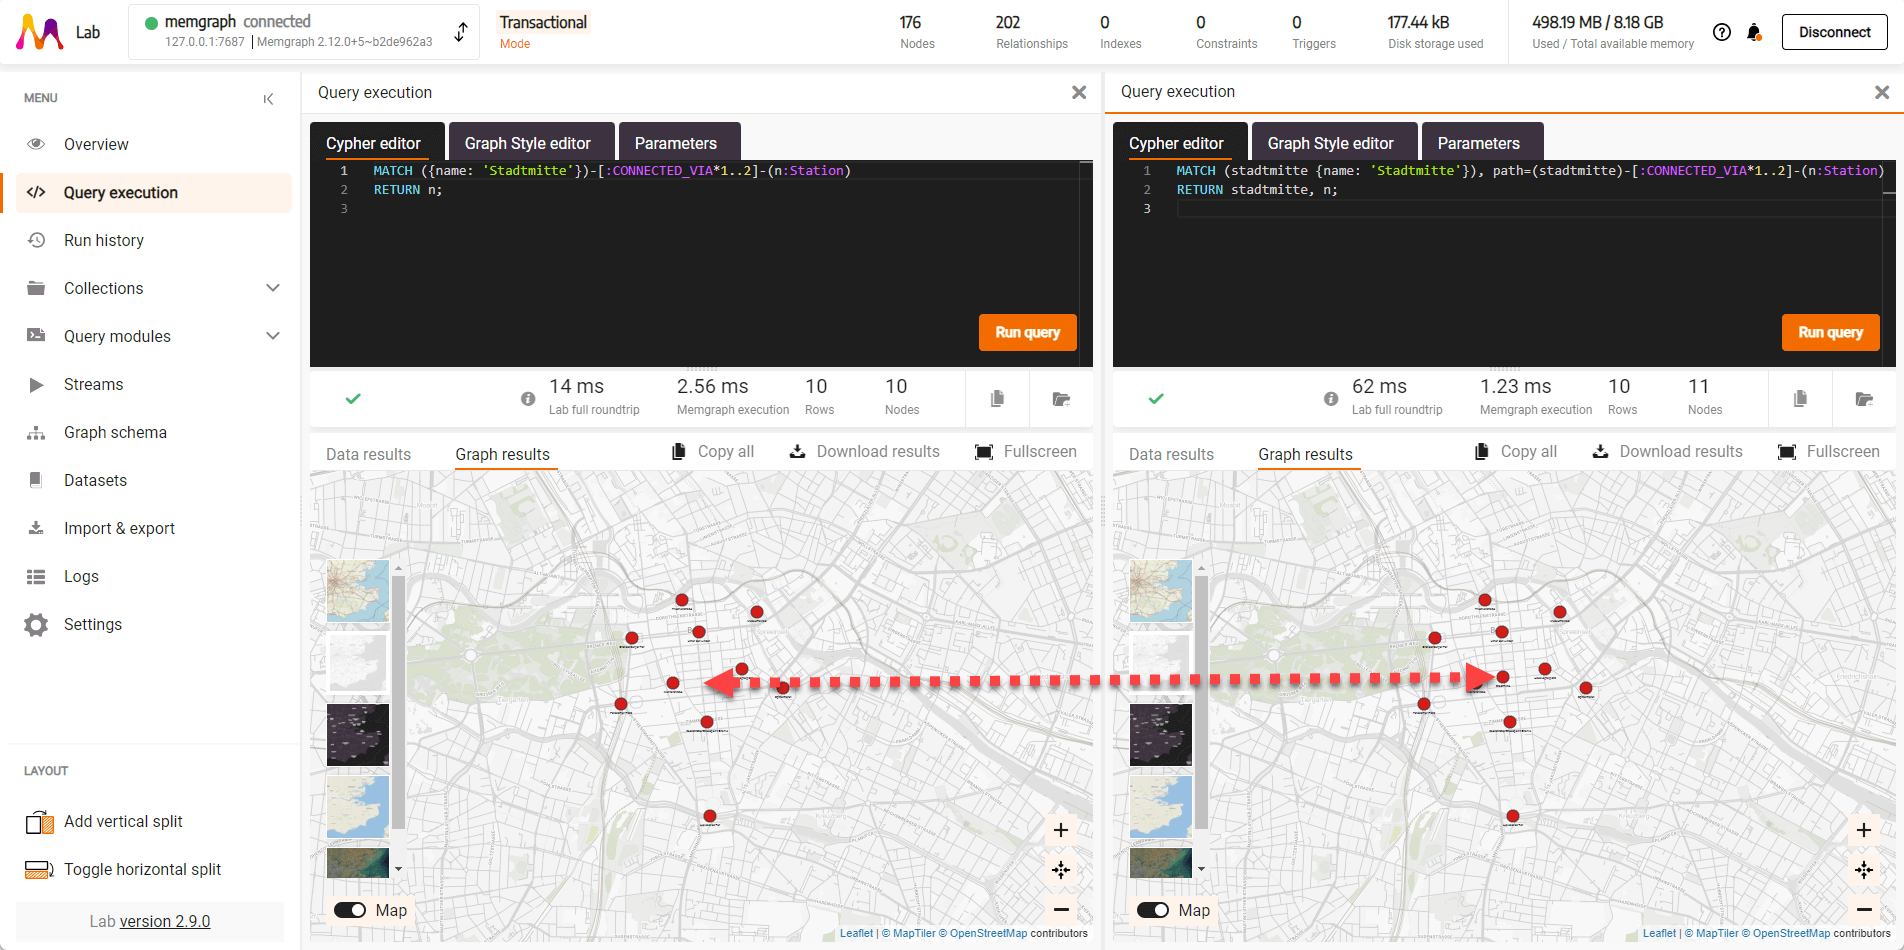
Styling Graphs
Add colors to the subway lines using the Graph Style Editor. First, define node styles:
@NodeStyle {
 border-color: #000000
 border-width: 1
 color: #aaaaaa
 color-hover: #aaaaaa
 color-selected: #aaaaaa
 size: 4
 font-size: 10
}

@NodeStyle Equals(Property(node, "end"), 1) {
 border-color: #000000
 border-width: 1
 color: #444444
 color-hover: #444444
 color-selected: #444444
 size: 6
 font-size: 14
}
Then add colors for each line based on official RAL color values from Wikipedia:
@EdgeStyle {
  label: Property(edge, "line")
  width: 4
  width-hover: 8
  arrow-size: 0
  font-size: 10
}

@EdgeStyle Equals(Property(edge, "line"), "U1") {
  color: #50C878
  color-hover: #50C878
  color-selected: #50C878
}

@EdgeStyle Equals(Property(edge, "line"), "U2") {
  color: #D84B20
  color-hover: #D84B20
  color-selected: #D84B20
}
Takeaway
You’ve learned how to import and visualize complex subway networks, run insightful queries, and style your results for maximum impact. These skills open up a world of possibilities for data analysis and visualization. The subway network of Berlin is just the beginning — there are endless networks and connections out there waiting to be discovered and understood.